RESEARCH 003 · LANGUAGE & CARE · UNITED STATES
Being heard is part
of being cared for.
Across US counties, language limitation is associated with poorer hospital communication ratings. Explore communication, preventive contact and 198 counties for further investigation.
Explore the findings ↓01 / OVERVIEW
Communication is part of access.
Across 2,019 US counties, greater language limitation is associated with poorer ratings of hospital medical communication. Parallel analyses also identify lower estimated routine checkup prevalence and lower use of hospital outpatient services.
We connect patient-reported hospital experience, Census language estimates and healthcare-use indicators to identify territorial patterns worth investigating. These sources describe different populations; they do not trace one patient journey.
02 / KEY FINDINGS
Being understood matters throughout care.
1. A consistent communication gradient
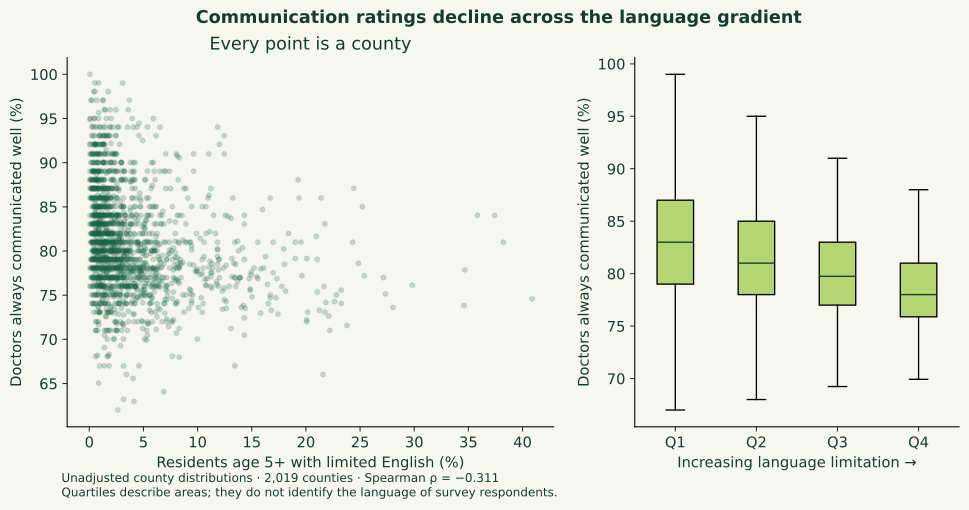
Among 2,019 counties with eligible data, language limitation and the share of patients reporting that doctors always communicated well show an inverse association: Spearman ρ = −0.311. Median favourable county ratings decline from 83% to 78% between the lowest and highest language-limitation quartiles. This five-point contrast is descriptive and unadjusted.
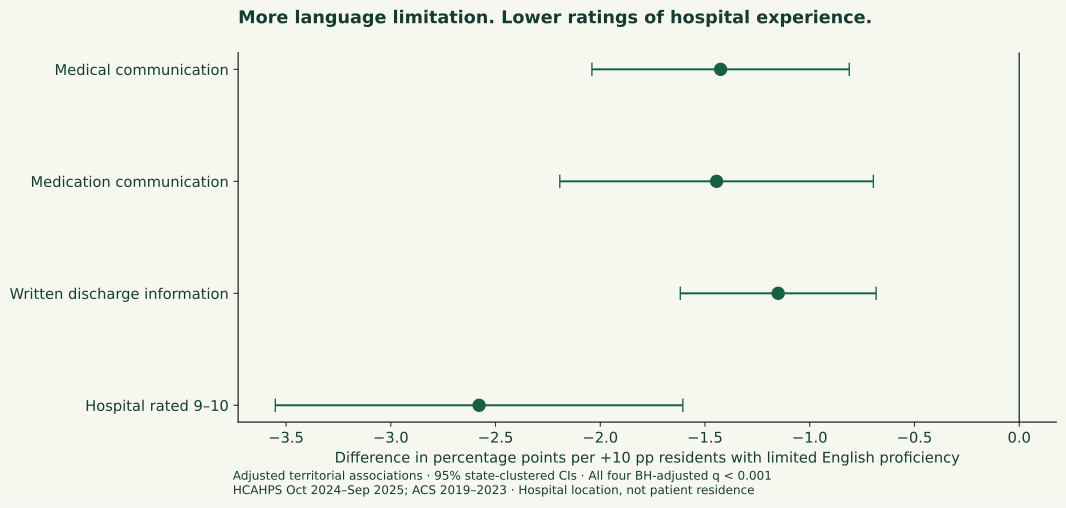
After territorial adjustment, each +10 percentage points of residents aged 5+ with limited English proficiency is associated with 1.43 percentage points lower favourable medical-communication ratings (95% CI −2.04 to −0.81). The slope remains negative when each state is excluded in turn: −1.69 to −1.35 points.
2. The pattern extends to medication explanations and discharge information
The adjusted difference in favourable communication about medicines is −1.44 points (95% CI −2.19 to −0.70; 2,018 counties). Written information about symptoms to watch for after discharge is −1.15 points (−1.62 to −0.68; 1,794 counties). Hospital ratings of 9–10 are also lower: −2.58 points (−3.55 to −1.61). All four associations remain statistically significant after Benjamini–Hochberg correction (q < 0.001).
3. Parallel signals in preventive contact and service use
Across 29,856 ZCTAs, greater language limitation is associated with lower model-estimated routine checkup prevalence (ρ = −0.346). The inverse association persists, with a smaller magnitude, in detailed age and ethnic-composition sensitivity analyses. PLACES estimates are model-based; this is not a direct survey estimate for every ZCTA.
In a separate analysis of 3,122 counties, a +10-point increase in limited English proficiency among residents aged 65+ is associated with approximately 300 fewer hospital outpatient visits per 1,000 Original Medicare beneficiaries (95% CI −508 to −91; BH q = 0.023). This is general hospital outpatient use, not cardiology-only care. Adjusted evaluation-and-management, emergency and inpatient results do not show a consistent overall reduction.
4. Where should communication needs be investigated first?
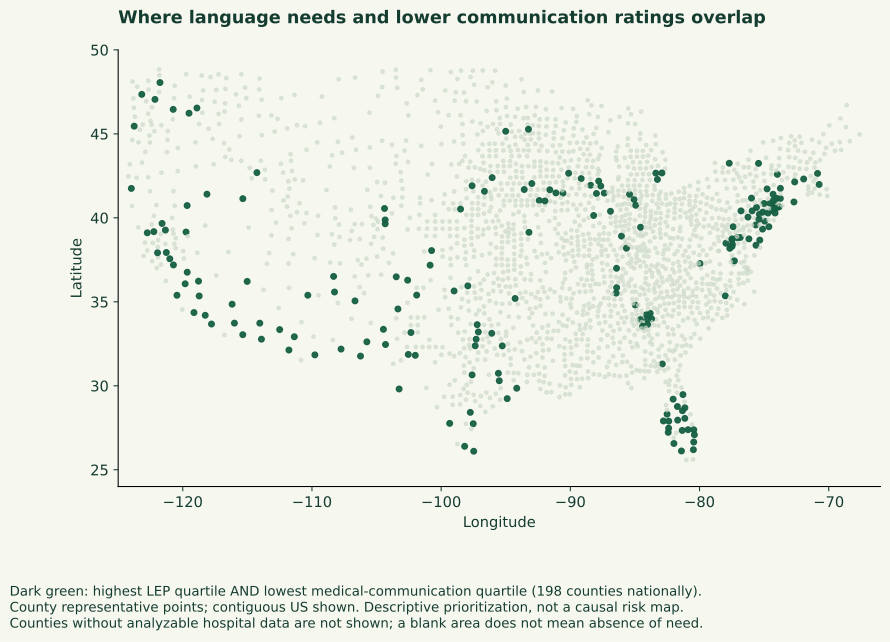
198 counties combine the highest language-limitation quartile (≥4.37% of residents aged 5+) and the lowest medical-communication quartile (≤78% favourable). These relative thresholds identify places for local assessment, not a validated risk score.
From observation to opportunity
Investigate interpreter access, understandable medication instructions, discharge support and patient navigation with local communities. The map helps ask where to start; it does not establish which intervention will work.
03 / METHODOLOGY
How we connected the evidence.
This exploratory ecological research brief links ACS 2019–2023 five-year language estimates to CMS HCAHPS hospital experience from October 2024 to September 2025, with separate PLACES and 2023 Original Medicare analyses. Limited English proficiency means speaking English less than “very well”; it is not synonymous with Hispanic or Asian ethnicity.
Hospital experience and territorial aggregation
Four indicators were selected before calculation: medical communication, medication communication, written symptom information at discharge, and hospital rating 9–10. CMS already adjusts HCAHPS for patient mix and survey mode. Hospital scores are aggregated by hospital-location county using completed-survey counts as weights; these are total counts, not question-specific valid responses. The regression gives each eligible county equal weight.
County names are matched to Census geography using state and normalised names; ambiguous or unmatched rows are excluded. Each indicator contains 4,790 hospital records, of which 119 have unmatched county geography before outcome and covariate exclusions. Missing or suppressed scores are not treated as zero.
Models and uncertainty
Linear models include log household income, bachelor’s attainment, Medicare beneficiary mean age, Medicare Advantage share, categorical RUCC and state effects. Standard errors are clustered by state, with t-based 95% intervals. Benjamini–Hochberg correction covers the four hospital-experience tests. Leave-one-state-out analysis assesses dependence on a single state; it is not a spatial validation or an independent replication.
Separate contact and utilisation analyses
The ZCTA routine-checkup analysis uses PLACES 2024 model-based adult estimates and Census language exposure, with socioeconomic, demographic, density and state adjustment plus detailed-age and ethnic-composition sensitivities. Medicare outpatient analysis uses older-resident language limitation and county-level service rates, adjusted for income, education, beneficiary age, Medicare Advantage share, beneficiary count, RUCC and state. Its BH correction covers eight utilisation tests. Populations, units, years and geographical scales differ.
Map definition
The 198-county screen intersects the highest LEP quartile and lowest medical-communication quartile among the 2,019 eligible counties. County representative points are shown, not hospital catchments. Blank locations can reflect missing eligible data. The selection is descriptive and is not optimised against mortality.
04 / LIMITATIONS
Territorial evidence. Questions for local investigation.
These associations do not establish causality, individual language concordance or avoidable clinical harm. HCAHPS respondents are not identified here by language, and hospitals may serve patients from other counties. This is not a representative satisfaction survey of county residents, nor an exclusively cardiovascular analysis.
Age and insurance covariates in the hospital-experience model describe Medicare beneficiaries, not all HCAHPS patients. Hospital size, teaching status, service mix, patient flows, residual demographic differences and spatial dependence require further sensitivity analysis. Statistical significance does not resolve these limitations.
PLACES outcomes are modelled using demographic and contextual characteristics; some observed associations may reflect those inputs. Original Medicare use does not represent all residents, and lower utilisation does not by itself demonstrate unmet need. The sources do not establish that the same people have less preventive contact and poorer communication.
No consistent excess in cardiovascular events or mortality has been established in these analyses. Provider-language availability has not been shown to modify the findings: a regional insurer directory confirms feasibility of collecting declared languages, but does not provide nationally representative coverage.
05 / CONCLUSION
Make communication part of the care pathway.
Greater territorial language limitation is associated with poorer hospital medical communication, medication explanations and discharge information. Separate preventive-contact and outpatient-use findings broaden the questions worth investigating, without establishing a single causal pathway.
The 198-county screen translates these observations into a practical research agenda: work with communities and healthcare organisations to assess language support, patient navigation and continuity. Being heard and understanding the next step are meaningful dimensions of healthcare access.
06 / SOURCES
Open data. Transparent questions.
- CMS HCAHPS hospital patient-experience dataset: October 2024–September 2025.
- CMS HCAHPS methodology and patient-mix adjustment.
- US Census ACS: 2019–2023 five-year language and socioeconomic estimates, including C16001 and B16004.
- CDC PLACES methodology: model-based small-area adult health estimates, 2024 release.
- CMS Medicare Geographic Variation: 2023 utilisation.
- USDA RUCC 2023.
- US Census Gazetteer: 2023 county identifiers and representative coordinates.
07 / CITE & DOWNLOAD
Explore, reuse and question.
- Hospital communication results (JSON)
- Map screening and state sensitivity (JSON)
- All eight Medicare utilisation results (JSON)
- Routine checkup sensitivities (JSON)
- Citation (TXT)
The Smart Mole Institute. Being heard is part of being cared for. Open research brief 003. Version 1.0. 13 October 2026. Exploratory ecological analysis; not peer reviewed.
08 / CONTINUE THE CONVERSATION
What should we
investigate next?
Share a question, suggest a correction, or explore collaboration on language access and patient communication.
Contact the Institute ↗